Lansing's Housing Crisis: By the Tract

LANSING, Mich. — Part 1 showed that 70% of Lansing renter households do not earn enough to cover housing and basic needs. Part 2 showed that 40% of homeowner households face the same deficit. Part 3 showed that 65,000 workers in the metro area earn median wages below the threshold. Those posts described the crisis across Lansing as a whole. This post, using Census tract data, CDC health statistics, and county assessment records, shows where in the city the crisis is worst and who lives there.
Key findings
- The 17 lowest-income tracts (median household income under $50,000) are 52.5% nonwhite on average, with a hardship rate of 51.7% and 15 of 17 classified as areas of food apartheid. The 5 highest-income tracts (above $65,000) are 28.0% nonwhite, with a hardship rate of 26.6%.
- Tract 7 (48906): median income $39,397, 66.5% nonwhite, 69.4% hardship. Tract 33.02 (48906): median income $84,375, 30.2% nonwhite, 12.4% hardship, both in the same ZIP code.
- The lowest-value homes are in the tracts with the highest poverty rates, and Part 2 showed those homes are assessed at 188% of sale price. The households least able to pay are taxed the most per dollar of actual home value.
The map

1935
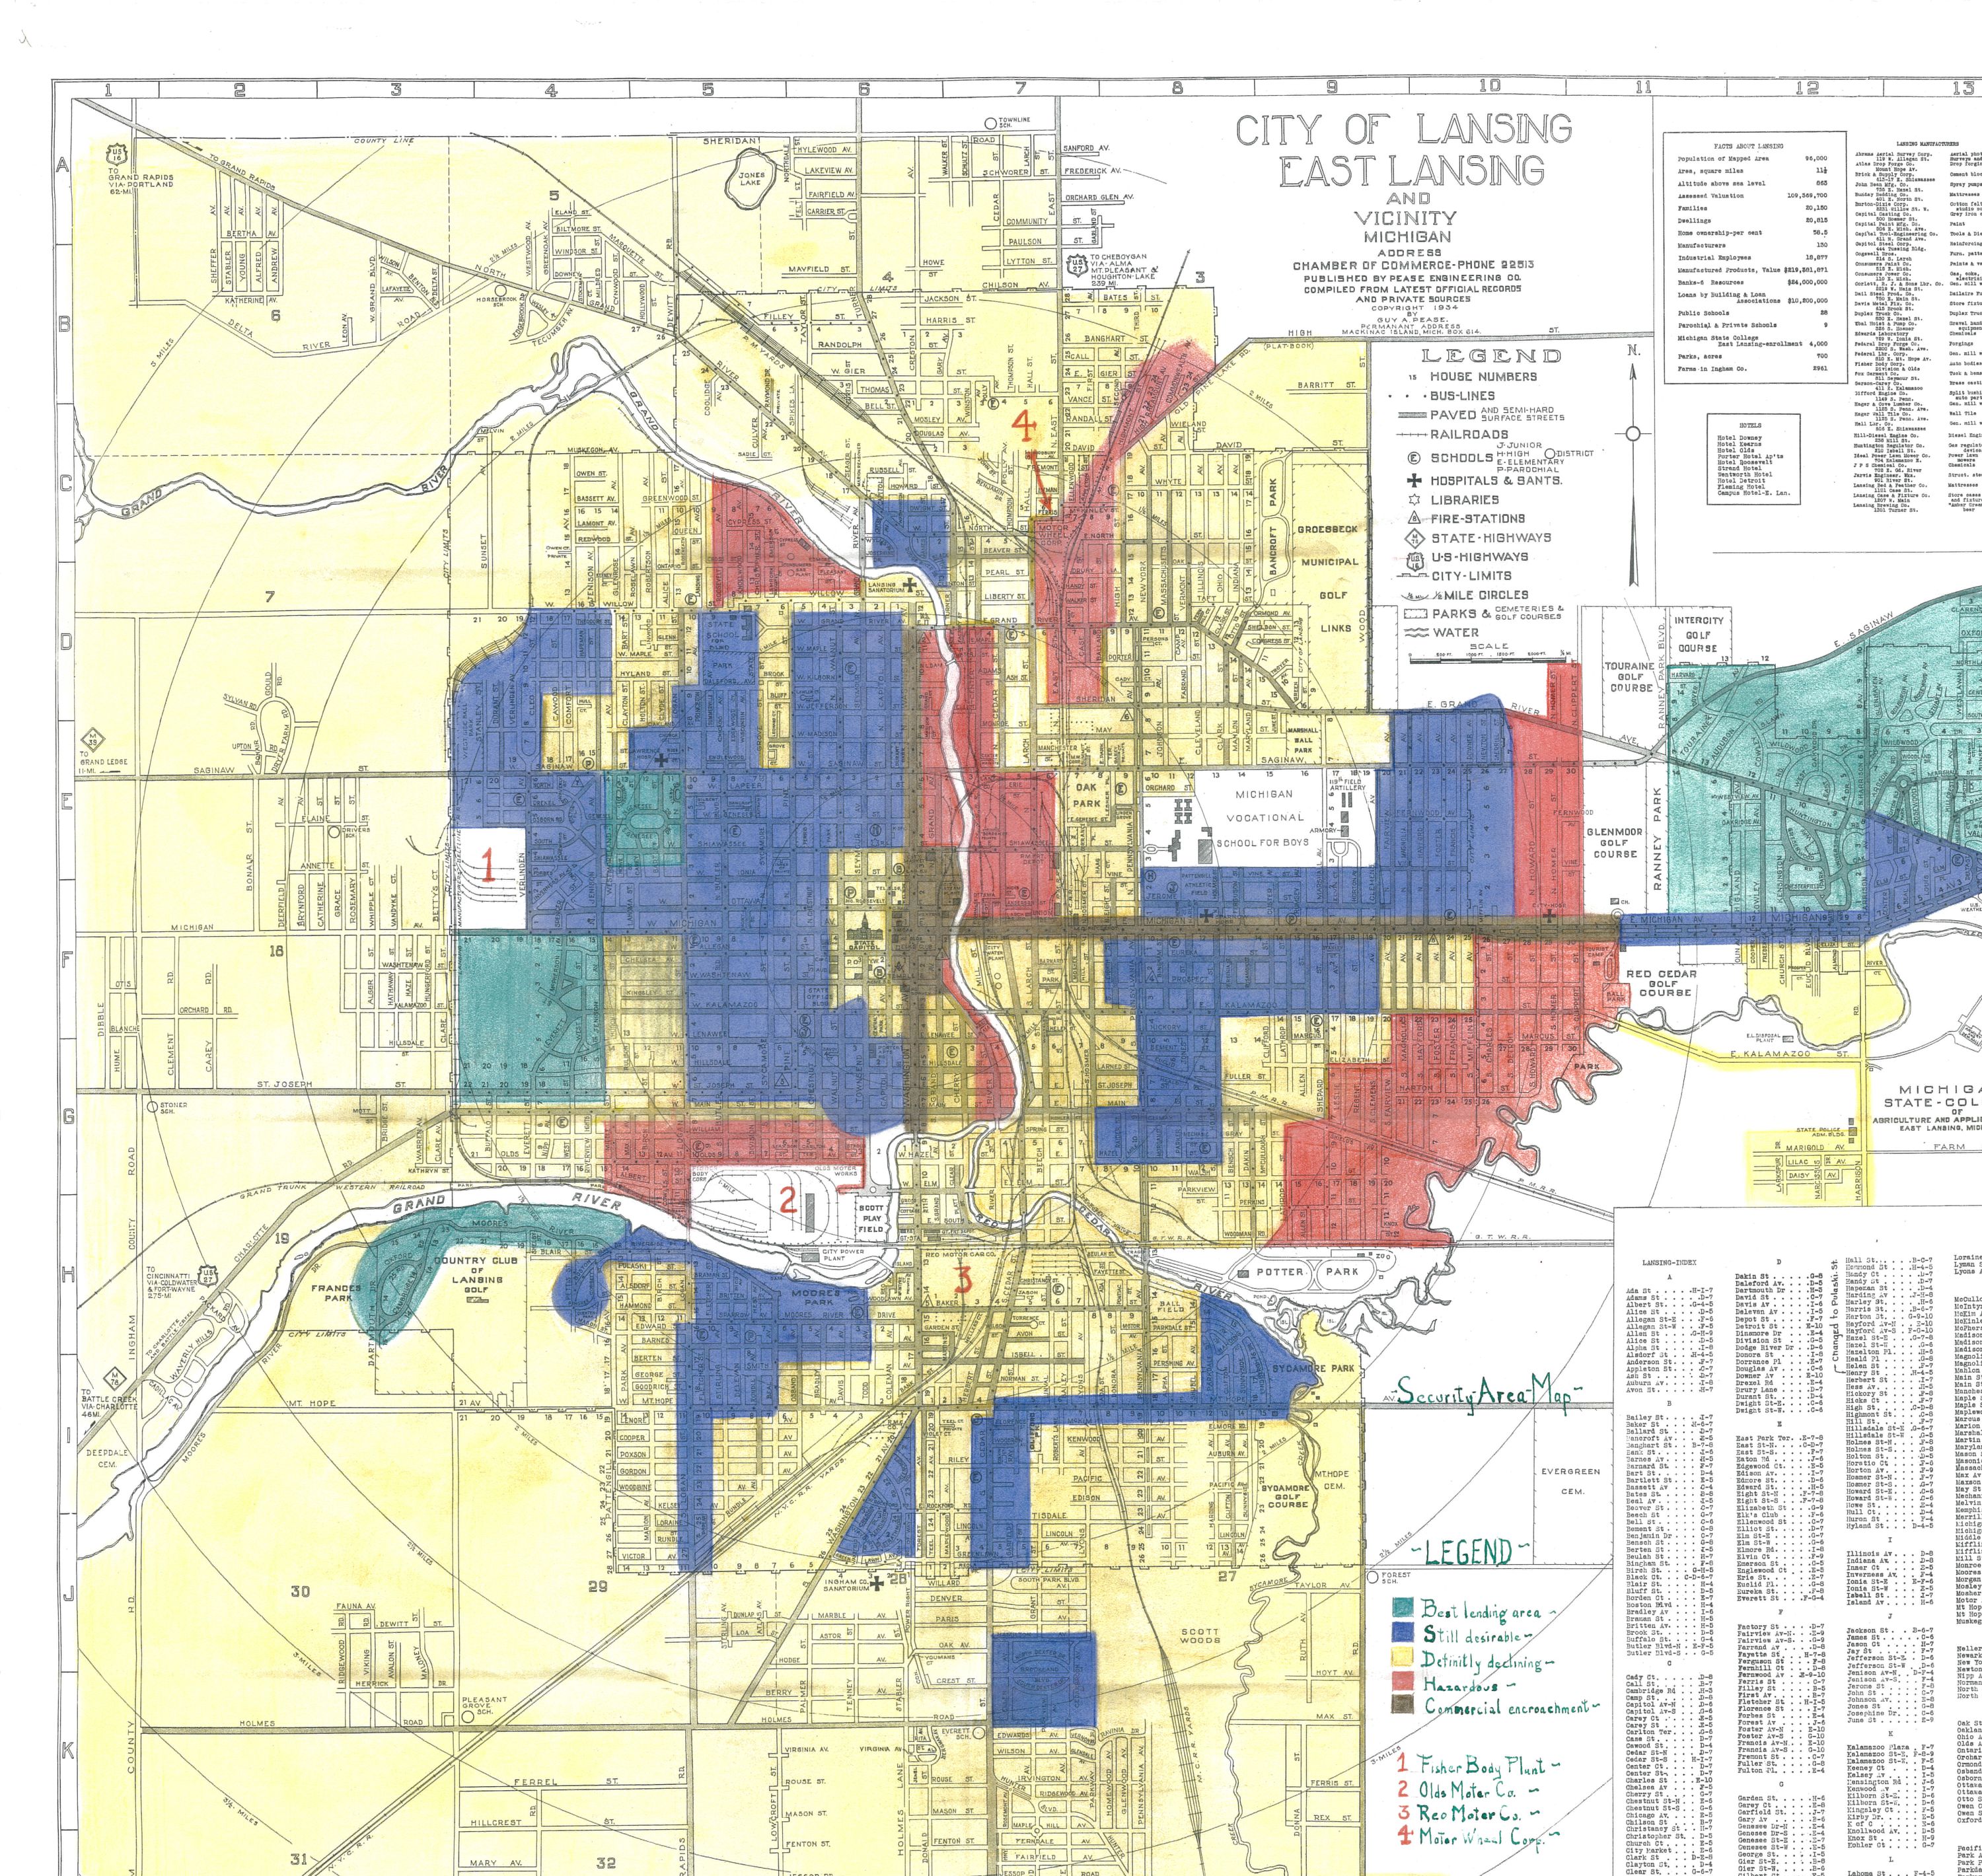
In 1935, the federal Home Owners' Loan Corporation graded Lansing's neighborhoods from A ("Best," green) to D ("Hazardous," red). The MSU Extension redlining project notes that the area description files for Lansing, which would document the racial language used to justify each grade, have not been located and may no longer exist.
The table below ranks 35 Lansing-area census tracts by median household income, with ZIP code for orientation and the HOLC grade from 1935 where one was assigned. The only D-grade tract, Tract 12 in 48912, today has a median income of $41,495, a nonwhite population of 56.6%, and a hardship rate of 66.7%. The only A-grade tract, Tract 38.01 in 48823, has a median income of $90,868 and a hardship rate of 21.7%.
| Tract | ZIP | 1935 | Income | Poverty | Nonwhite | Home value | Hardship | Low access |
|---|---|---|---|---|---|---|---|---|
| 37 | 48910 | C | $34,253 | 22.1% | 54.4% | $109,900 | 43.0% | Y |
| 53.04 | 48911 | $37,188 | 29.1% | 64.3% | $98,600 | 55.1% | ||
| 7 | 48906 | B | $39,397 | 43.0% | 66.5% | $108,600 | 69.4% | Y |
| 66 | 48906 | C | $39,852 | 31.5% | 50.8% | $106,800 | 49.6% | Y |
| 6 | 48933 | B | $41,384 | 27.0% | 38.4% | $113,700 | 46.4% | Y |
| 29.02 | 48910 | C | $41,494 | 29.6% | 56.2% | $93,800 | 52.5% | |
| 12 | 48912 | D | $41,495 | 25.1% | 56.6% | $86,900 | 66.7% | Y |
| 67 | 48915 | C | $41,579 | 17.9% | 49.3% | $165,700 | 49.4% | Y |
| 20 | 48910 | C | $41,645 | 25.9% | 41.8% | $58,900 | 61.7% | Y |
| 52.01 | 48911 | $42,414 | 18.3% | 56.9% | $72,900 | 44.2% | Y | |
| 1 | 48906 | C | $44,611 | 16.0% | 44.2% | $80,300 | 40.2% | Y |
| 36.02 | 48911 | C | $45,052 | 29.8% | 58.7% | $98,900 | 53.3% | Y |
| 32 | 48906 | C | $46,500 | 25.8% | 40.0% | $84,300 | 47.9% | Y |
| 51 | 48911 | C | $46,816 | 16.9% | 42.4% | $96,900 | 41.1% | Y |
| 21.01 | 48912 | C | $46,920 | 20.0% | 74.1% | $76,100 | 47.6% | Y |
| 33.01 | 48906 | C | $47,955 | 30.4% | 50.4% | $121,000 | 49.6% | Y |
| 8 | 48906 | C | $48,627 | 26.1% | 48.2% | $74,600 | 60.3% | Y |
| 23 | 48910 | C | $50,318 | 16.2% | 32.3% | $98,600 | 44.6% | |
| 68 | 48915 | C | $50,533 | 17.2% | 54.4% | $65,100 | 44.1% | Y |
| 26 | 48910 | C | $51,250 | 20.5% | 58.4% | $96,100 | 34.5% | Y |
| 65 | 48912 | B | $51,698 | 19.2% | 29.5% | $132,300 | 39.9% | Y |
| 53.03 | 48911 | $52,841 | 14.8% | 57.6% | $143,400 | 51.1% | Y | |
| 10 | 48912 | B | $53,656 | 18.8% | 25.5% | $110,400 | 38.0% | Y |
| 27 | 48910 | C | $56,944 | 13.4% | 47.3% | $97,400 | 30.5% | Y |
| 17.03 | 48911 | C | $57,075 | 7.8% | 46.6% | $182,700 | 35.5% | |
| 53.06 | 48911 | $57,131 | 17.6% | 24.1% | $144,200 | 31.7% | ||
| 29.01 | 48910 | C | $59,191 | 13.8% | 28.7% | $146,900 | 33.8% | Y |
| 31.03 | 48912 | C | $62,658 | 16.8% | 38.5% | $184,500 | 30.7% | |
| 28 | 48910 | C | $63,281 | 17.5% | 17.2% | $102,900 | 34.8% | Y |
| 36.01 | 48911 | C | $63,938 | 20.8% | 70.5% | $102,800 | 42.6% | Y |
| 4 | 48915 | B | $65,188 | 11.9% | 21.9% | $101,300 | 33.9% | |
| 22 | 48910 | C | $67,404 | 15.7% | 19.9% | $129,900 | 30.5% | |
| 70 | 48910 | C | $68,629 | 8.5% | 35.2% | $115,500 | 34.4% | Y |
| 33.02 | 48906 | C | $84,375 | 5.4% | 30.2% | $163,600 | 12.4% | |
| 38.01 | 48823 | A | $90,868 | 9.0% | 32.8% | $203,600 | 21.7% |
The 17 tracts below $50,000 median income are 52.5% nonwhite on average, with a hardship rate of 51.7% and 15 of 17 classified as areas of food apartheid. The 5 tracts above $65,000 are 28.0% nonwhite, with a hardship rate of 26.6%. The five B-grade tracts (4, 6, 7, 10, and 65) have an average median income of $50,265, with 36.4% nonwhite population, four of five classified as areas of food apartheid, and 69% of their housing stock built before 1950.
Health
CDC PLACES obesity rates average above 35% in the 12 lowest-income tracts and below 30% in the 4 highest-income tracts, and diabetes rates above 13% versus below 11%. In Tract 7 (median income $39,397, 66.5% nonwhite, 48906), 69.4% of residents meet the hardship threshold, the highest rate in the city, compared to 12.4% in Tract 33.02 (median income $84,375, 30.2% nonwhite, same ZIP).
Assessment
Part 2 found that Lansing homes that sold under $50,000 are assessed at 188% of their sale-price-based value. The lowest-value homes in the table above are concentrated in the tracts with the lowest incomes, the highest poverty rates, and the highest nonwhite population shares.
A homeowner in Tract 20 (median home value $58,900, 48910) and a homeowner in Tract 31.03 (median home value $184,500, 48912) both pay 62.6 mills. But the Tract 20 homeowner's assessed value is more likely to exceed their home's actual market value, meaning they pay a higher effective rate on what their home is actually worth.
Related
- Food access: The USDA Food Access Research Atlas identifies 25 of the 35 tracts above as low-income, low-access areas.
- Eviction geography: 55th District Court eviction filings, mapped by address to census tract, would show whether eviction rates follow the same income and demographic patterns.
Sources and methodology
Census data: ACS 5-year 2023, B19013 (median household income by tract), B03002 (race and ethnicity, used to compute nonwhite share), B25077 (median home value), B17001 (poverty status). Health data: CDC PLACES 2024 release, tract-level modeled estimates. Assessment data: Part 2 analysis of City of Lansing 2025 parcel export. Mill rate: 2025 Ingham County Apportionment Report.
This analysis covers 35 census tracts within and adjacent to Lansing city, excluding institutional tracts (9801, 9802) and one suburban tract (102.04). ZIP codes from the Census 2020 ZCTA-to-tract crosswalk, assigned by largest area overlap. Lansing extends into Eaton County (western neighborhoods), which are not included. HOLC grades from Mapping Inequality (University of Richmond), overlaid to census tracts by predominant zone coverage. Hardship rate combines poverty, ALICE (Asset Limited, Income Constrained, Employed), and housing cost burden from ACS and United for ALICE.
More from Housing
All Housing →
Public Housing Commission Conflict-of-Interest Standards
Rhinoceros NewsroomApr 26, 2026
Federal and Michigan rules that govern conflicts of interest on a public housing commission cluster around four authorities: HUD's mixed-finance development standard at 24 CFR §905.604, the federal-award procurement standard at 2 CFR §200.318(c), Michigan's public officer conflict statute at MCL 15.321 et seq., and the Lansing Housing Commission's own bylaws. Each rule names a specific prohibited conduct, a required disclosure or recusal, and a specific body authorized to act when conditions covered by the rule appear in the public record. HUD's Office of Public Housing Investments (working through the HUD Detroit Field Office for Michigan) and the Michigan Attorney General's Public Integrity Unit hold the federal and state authority respectively.

What Is the Lansing Housing Commission?
Rhinoceros NewsroomApr 26, 2026
The Lansing Housing Commission is the City of Lansing's public housing authority, chartered in 1964 under MCL 125.651 and governed by a five-member volunteer board appointed by the Mayor. As of 2025 LHC operates 66 public-housing units (down from 833 in 2020), administers 2,252 federal Section 8 vouchers and 253 project-based vouchers, and acts as development partner on a Low-Income Housing Tax Credit pipeline of more than $200 million in active project cost. Three of the people sitting in LHC's governance hold paid positions at organizations that earn fees from LHC's deals: Board Chair Emma Henry at Capital Area Housing Partnership ($123,787/year per its FY2025 IRS Form 990), Commissioner Ashlee Barker at Cinnaire (the standing purchaser of LHC's tax credits), and Executive Director Doug Fleming as agent of the General Partner LLCs collecting developer fees on LHC LIHTC partnerships.

Federal Housing Dollars in Lansing: The Network Around the LHC
Rhinoceros NewsroomApr 26, 2026
Roughly $200 million in federal Low-Income Housing Tax Credits flow through LHC's Lansing-area development pipeline, plus federal voucher subsidies for 2,252 households. The pipeline moves through a small cluster of nonprofit, private, and law-firm entities and a recurring set of individuals who hold multiple roles across them. LHC Board Chair Emma Henry earns $123,787 a year as Executive Director of Capital Area Housing Partnership, the nonprofit named as partner on LHC LIHTC deals her board approves. Commissioner Ashlee Barker is paid Vice President at Cinnaire, the financial institution the LHC executive director identified as the standing purchaser of LHC's tax credits. The 2024 LHC board minutes record one Henry abstention out of fifteen-plus substantive resolutions, and zero Barker recusals across eight 2024 board meetings.